A centralized operations management system for controlling port calls
A unified system for a port agency: port calls, stay events, tasks and costs in one place, replacing the BI tool, the spreadsheet and the task manager.
- Vessel line-up always up to date
- SOF and laytime without spreadsheets
- Indicators without a hand-fed BI
The challenge
The agency tracked each port call in three tools that did not talk to each other. Vessel data and stay events were entered in a spreadsheet, the team's pending items (documentation, pilotage, tugboats, clearances) lived in a separate task manager and the indicators depended on a BI tool fed by hand. The same data was typed more than once, laytime was calculated outside the system and the dashboard figure did not always match the spreadsheet.
The solution
A system in which the port call is created once and serves everything. The vessel record feeds the line-up, the stay events build the Statement of Facts and the laytime calculation, each call's tasks come from standardized checklists and costs are posted against the call itself, from proforma to closing. Indicators are calculated straight from the data, with no export or spreadsheet in between.
What was delivered
-
Vessel line-up
ETA, ETB and ETS for each port call on a single dashboard, with the status updated by the team itself.
-
Port call record
Vessel, IMO, owner, berth, cargo and quantities in standardized, validated fields, instead of free-form spreadsheet rows.
-
Statement of Facts
NOR, berthing, start and end of operations and unberthing recorded as they happen, with laytime calculated by the system.
-
Checklist per port call
Documentation, pilotage, tugboats and clearances as tasks with an owner, deadline and status.
-
Port call costs
Expenses posted against the port call, with the proforma DA compared to the final one.
-
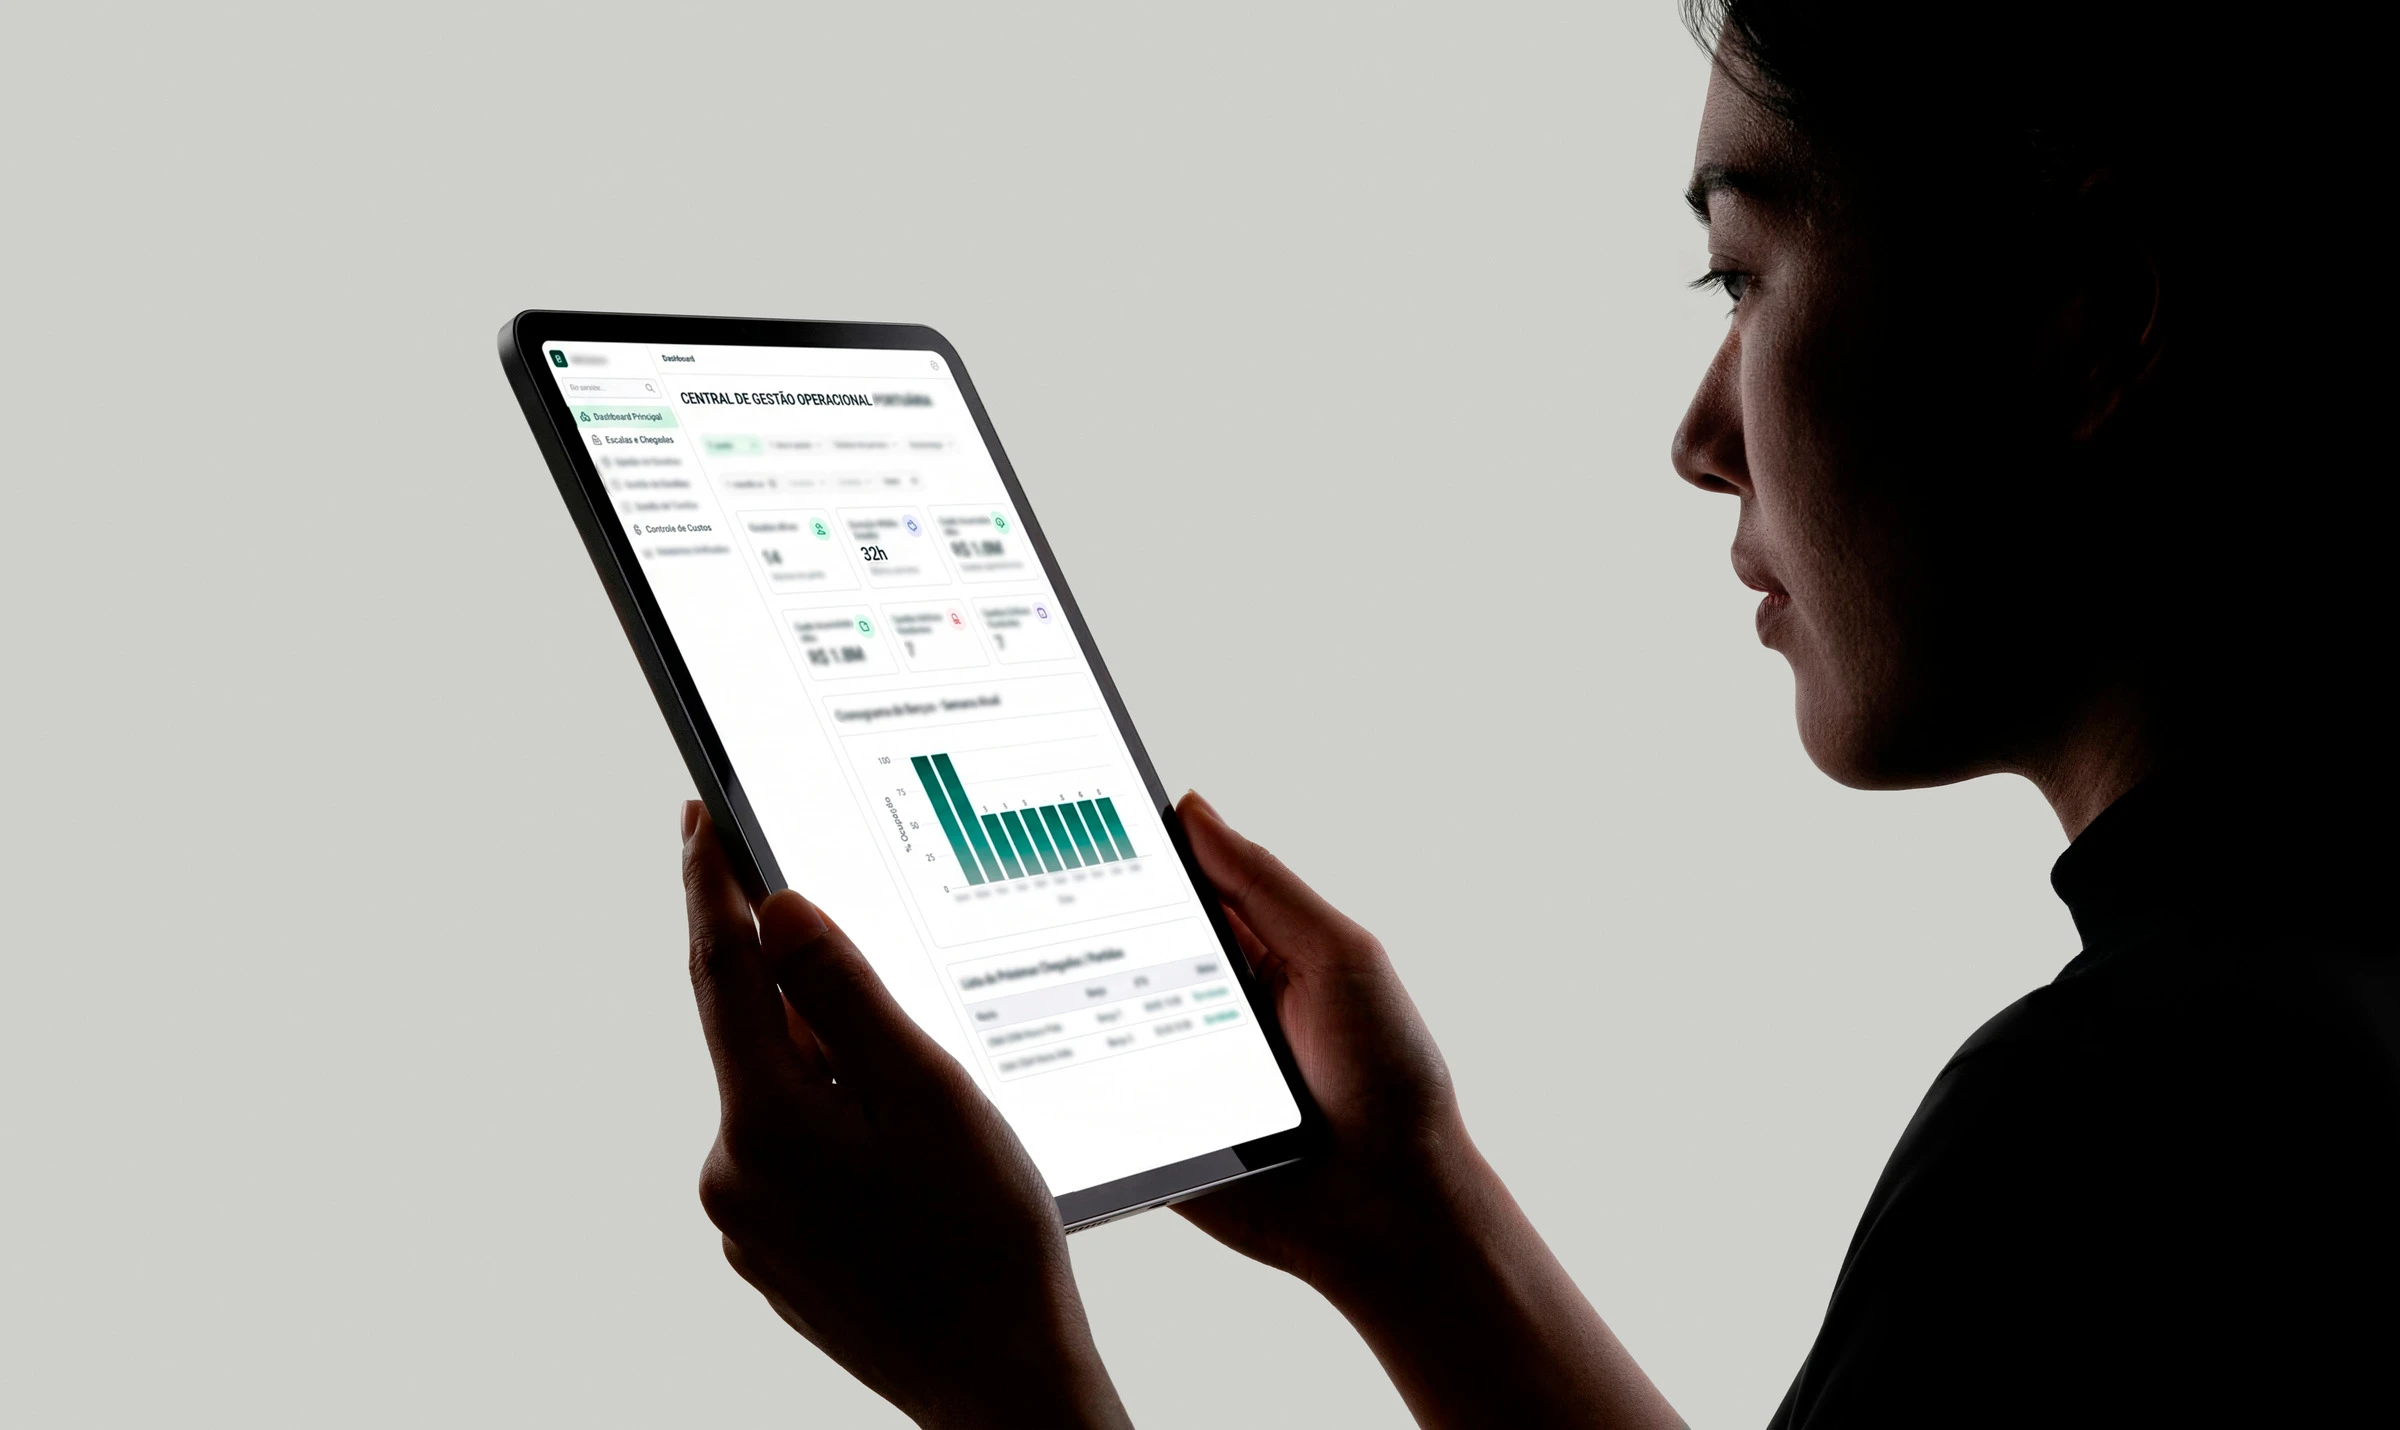
Indicators from the data itself
Waiting time, time at berth, average handling rate and port calls per client, with no manual updates.
Modules
- 01
Port calls and line-up
Vessel and port call records, arrival and berthing windows and the port line-up.
- 02
Operations
Stay events, Statement of Facts and laytime and demurrage calculation.
- 03
Tasks
Checklists by type of port call, with pending items, owners and deadlines.
- 04
Port call finance
Proforma and final DA, expenses by supplier and closing of each service.
- 05
Indicators
Dashboards by period, client, berth and cargo type, calculated from the system's data.
- 06
Administration
Users, access profiles, supporting records and change history.
Access profiles
-
Operations
Records the port call and the stay events and completes the tasks linked to it.
-
Coordination
Follows the line-up, assigns tasks and checks records before closing.
-
Finance
Posts expenses, checks the DA and closes the costs of each port call.
-
Management
Tracks operational indicators without depending on spreadsheets.
Integrations
- Import of the spreadsheet history
- Port call reports in PDF
- Email alerts
How it was built
- Web system Next.js + TypeScript
- System and dashboard screens, with large tables and filters that respond quickly.
- Back end Node.js (NestJS)
- An API with the operation's rules, the laytime calculation, role-based permissions and a log of every change.
- Database PostgreSQL
- A single base of port calls, events, tasks and costs, with aggregate queries for the dashboards.
- Infrastructure AWS
- Hosting, automatic backups and storage of the documents attached to each port call.
Details
At a port agency, the work revolves around a port call: a vessel arrives, waits, berths, operates and leaves, and each of these stages generates documents, tasks and costs. When those three things live in separate tools, the team spends the day reconciling information instead of following the vessel.
The system treats the port call as the central record. Everything that happens to the vessel is linked to it, from the line-up to the financial closing, which is why the indicators no longer depend on someone building the BI at the end of the month: they read the same data the operation works in.
This project is an example of our work with custom software for operations with processes of their own.